
SYSTEM ANALYST
As per our discussion in last lecture that each system has certain interacting elements. These elements interact with each other in a certain way so as to produce the required output from the given inputs. As we are dealing with man-made systems, so it is man who decides about what should be the inputs for a particular system and in what way different elements should react with each other to produce the desired output. This particular man who analyse (new and existing) and design or redesign the system is called System Analyst. The concept of systems would impose upon the System Analyst to look at the system as a whole.
The primary task of the system analyst is to analyse and design a system which is absolutely new or make a existing system more effective by modifications or by substantial redesign.
The system involved could be economic, political, social institution such as business houses, government agencies, colleges and universities and usually a computer could be considered as an aid for improving the systems operation.
System analyst may be responsible for system analysis, detail design of the computer system and outlining system specification.
The system analyst has two primary objectives
- Assessment objective
- Assistance objective
Assessment objective : A system analyst has to observe, understand and evaluate the interactions which routinely occurs as a part of the Job under investigation.
Herein the analyst has to know.
- What is being done ?
- Who is doing it ?
- Why is it being done ?
- How is it being done ?
- What are major problems in doing it ?
After the completion of assessment objective, the system analyst offers specific suggestions for improving the efficiency of Job under consideration. He does so by providing assistance.
Assistance Objective : A system analyst is to provide alternative solutions to make the existing system more efficient. For this job, he seeks the help of the computer. At such times he acts like a communication-link between technology and user. Analyst now finds out other ways to deal with the existing problem and also checks the benefits and liabilities associated with these alternative approaches.
Better assessment of problems will provide better assistance, and probably the presence of other kinds of assistance gives the analyst a broader perspective for the assessment.
A system analyst must have good communication with all the people affected. Communication skill of system analyst should be sharp as he depends on others for both information and co-operation. System analyst in facts is an agent of change.
 Loading...
SYSTEMS ANALYSIS TOOLS
The first and obvious purpose of a system analyst’s work is to establish precisely
- What the system is intended to achieve?
- What information enters it, leaves it and is held within it?
Only when he knows to what objectives a system is directed, and in a position to change or replace it.
The second purpose is to enable him to communicate with management at all levels, so that the findings of his investigations can be confirmed and possible changes discussed on the basis of common knowledge.
The third purpose is to design the system i.e. enter into system design stage.
Now we are discussing a few tools which can be used to establish these requirements of a system analyst’s job.
- Fact Finding Tools
- Interviews
- Questionnaire
- Observations
- Graphical Tools
- DFD
- Decision Tables
- Decision Trees
- Organisation Chart
- Flow Chart
- Other Tools
- Data Dictionary
Fact Finding / Data Gathering Tools
In System Analysis, the most important step to begin a task is the fact finding of the system to be analysed.
The system analyst does not have to know only what is happening in the present existing system, but also has to know what improvements are to be carried out. Its needs to study the complaints, suggestions and ideas for further improvements. It has to thus carry out a detailed study of strengths and weaknesses of the proposed system.
The system analyst has to be very careful during this stage so that the can not only find the facts but can also record it properly. He might have to follow different techniques for different situations which might include conducting interviews of persons at different levels of management or prepare questionnaires to collect the fact etc.
The most important thing to be kept in mind is that the system analyst must have obtained the Management approval for carrying out his fact finding studies. System Analyst can also discuss them for any other source of information they can suggest. He should also ensure that the staff of the department is intimated by the concerned manager about the study being carried out.
Interviews
After having known the structure of the organisation, the system analyst can now begin the process of meeting the people and conduct interviews for fact finding. It
is an important method used for getting the first hand information. Interviews must be planned properly so that there is no wastage of interviewee’s time. It is thus important to plan the questions already, to be asked and listed before the interview. The following care may be taken while conducting an interview.
- The system analyst should properly introduce himself to the interviewee during his first meeting.
- The interview should preferably be conducted at the work place of the person being interviewed. It helps to break a lot of communication barriers because the person feels at home and more comfortable at his own work place than any other formal place. Moreover, he can refer to his papers and documents with a greater ease.
- The system analyst should have a flexible approach that can be adapted to suit different people who are interviewed.
- The type of questions being asked should not irritate the person. The analyst should be very careful not to annoy him. He must give a very patient hearing to the explanation being given by the person. The system analyst must be a very good listener Some managers get irritated if they are interrupted while they are talking. So the analyst must give due time for him to speak.
The questions to be asked from the persons should have been recorded already. The right questions should be asked from the right person depending upon the level of the person. For example a Production supervisor should not be asked about the plans for integrating the system or type of database which should be used and the General manager should not be asked about the number of digits used in the item code.
- The system analyst should be recording the discussion properly by taking down notes throughout the interview. Generally the analyst should let the person being interviewed see that his ideas are being noted down. This gives him more confidence that his ideas being given due weightage and consideration and removes his fears about the investigation.
- The interview should conclude with a quick resume of the ground covered during the interview. This helps to ensure the accuracy of notes taken by the analyst and his understanding of the facts. It may also be appropriate at times that the system analyst leaves a copy of his notes which are jointly prepared with the person for his record.
- If it requires a further discussion of some topics, the system analyst should fix-up the tentative date for such an interview and finalise the topics to be discussed that day so that the person can get his replies ready for the meeting.
Observation
The another important fact finding technique is observation. The analyst may observe the work being done as it is being described to him. The combination of hearing and seeing is often more illuminating than one or the other alone as it reduces the chance of misunderstanding and omissions. Some important things which can be observed are
- The flow of documentation and important business transactions.
- Books being maintained for keeping the records and the frequency of their updation etc.
- The work environments like furniture layout, movement of person, and environment.
The findings of the observation also should be recorded properly which would help in the system design process.
Questionnaires
Questionnaires is another method of collecting information to analyse about a system. This technique could be combined with interviews to get the best results. There are situations where the number of persons to be contacted for a given system is too large or are geographically located at far off places and it is not possible for the analyst to go and interview all of them. In such situations, to take all those persons viewpoint, properly designed questionnaires may be used.
Questionnaires designed properly so that the person answering these questions does not feel hesitant to give the answers. This method is useful only in situations where a small amount of information is being sought from a large number of people. The questions should not be ambiguous leading to a confusion to the user. The expected answers should be as brief as possible. Each questionnaire should be accomplished by an explanatory note that serves to gain co-operation and avoid misunderstandings by setting out the purpose of the exercise clearly.
Graphical Tools
These are very effective tools for the use during the system analysis stage. Because, a picture is worth of thousand words i.e., a picture reveals information in a very concise and clear manner which can be explained in text by writing a thousand words. Thus, it is most important for a System Analyst to use graphical tools to express his findings and the requirements of a system rather than writing long lines of text. We shall be discussing a few of these graphical tools like Data Flow Diagrams, File layout charts, Decision Tables, System Charts etc.
Data Flow Diagram (DFD)
It is also known as Document Flow Diagram or Bubble chart . After the fact finding, the system analyst has to properly record the flow of documents within the organisation in the form of a chart known as Data Flow Diagram (DFD).
The very purpose of such a chart is to clearly show to the system analyst about the various documents being handled within the system, their organisation alongwith some major actions taken on those documents. This will also facilitate the system analyst to design the system suitably so that data can be captured at carious stages and input into the computer for up-to-date processing. This is also helpful in designing proper internal controls.
A DFD consists of series of bubbles joined by lines. The bubbles represent data transformations and the lines represent data flow in the system. To make a DFD, we can use various symbols to show the documents, direction of movement, the process of matching the documents, destroying or filing them etc. These symbols may vary from organisation to organisation.
DFD Symbols
We shall consider the following symbols as shown in figure
- A square defines a source or destination of system data.
- An arrow identifies data flow-data in motion. It is a pipeline through which information flows.
- A circle or a “bubble” represents a process that transforms incoming data flow into outgoing data flow.
- An open rectangle is a data store-data at rest, or a temporary repository of data.
For the purpose of drawing a DFD, following information should be carefully noted.
- The point of originating a given document
The document, internal and external, the flow through different departments, number of copies, distribution and other details etc.
- The books, it any, maintained and the details recorded therein and the source for the details.
- That there may exist one alternative possibility.
Decision Tree
Decision tree can be defined as the graphical representation of conditions and outcomes resembling the branches. A decision tree has as many branches as there are logical alternatives. It simply sketches the logical structure based on the stated policy.
It is an excellent tool, because, it is easy to construct, easy to read, and easy to update.
Also it shows only skeletal aspects of picture however, and does not lend itself to calculations. The alternative of decision tree is Structured English.
Consider an example : A publisher gives a different discount to different customers. If customer is bookseller, publisher gives a trade discount of 25% for the order of 6 copies or more per title. If orders from libraries and individuals, 5% allowed on orders of 6-19 copies per book title; 10% on orders for 20-49 copies per book title; 15% for the order of 50 or more per book title.
The above problem can be explained with the help of decision tree as shown in figure below
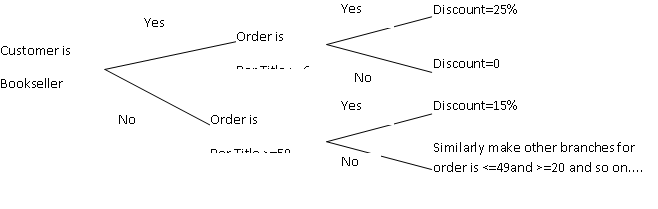
A decision tree has nodes which depicts the conditions, with each branch from a node depicting a possible path. Actions are given when conditions and branches end. As in above example, the decision tree is simple picture easy to understand.
Decision Tables
A way of expressing complex logical situation in a tabular form is known as Decision Table. These are very useful and versatile to be used in all stages of systems investigation and specification. They are not suitable for long sequences in which no or few alternatives are involved. It helps the system analyst to describe the various options available in a given situation and possible action which may be taken in a given set of alternative conditions. As the table helps to take decision in a complex situation, it is named a decision table. These are useful for clarifying the problems that are difficult to set down in the form of conventional flow charts. They are easily understood by non-computer users. These are easy to draw and understand.
Decision Table is most extensively used in applications dealing with artificial intelligence where there need to be a set of If—–then—–else rules to be applied, before taking a given decision. Their use is becoming more and more popular. The general structure of a decision table consists of four quadrants as shown in figure bellow.
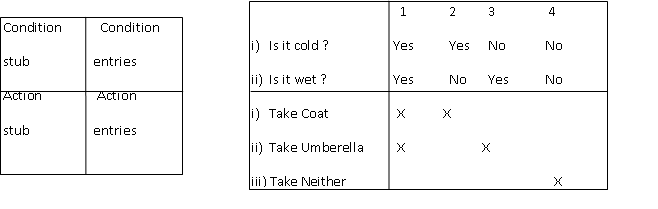
(A) (B)
As shown in figure (B), the conditions are listed in the top left hand section and actions are listed below. The right hand half of the table specifies the decision rules. One column is allocated to each rule. For any rule, the status of each condition, Yes (Y) or No (N) is given in the upper part of the column and the actions to be taken are indicated by a X in the lower part.
Consider the following simple logical situation
i) If it is cold and wet, I will take my coat and umbrella.
ii) If it is cold, I will take my coat
iii) If it is wet, I will take my umbrella
iv) If it is neither cold nor wet, I will take neither
This can be put in the form of a decision table as shown in above Figure (B)
There could be a situation where there are redundant conditions. That is, some conditions may not valid in some situations. So, we should not be writing Yes or No but instead put a hyphen there to indicate redundancy.
Comparison of Decision Tree and Decision Table
While a decision tree is easy to understand, for more complex situations, it is not practical. Suppose there is a situation where six factors influence an action, each taking one of the two values. A decision tree of this would go up to 2 raised to the power of 6, that is equal to 64 branches. Such a depiction would not be simple to understand and hence would not be useful.
A decision tree also does not prompt the analyst into questions about other combinations or conditions not tested. Then it is possible that some possible combination may not be shown or they may be missed.
Whereas, A decision table can depict complex conditions in a concise manner which is easy to understand and check. It is easy to make and maintain and is quite popular with users. A decision table does not depict processing logic order.
Organisation Chart
An organisation chart is a graphical representation of management structure/hierarchy. In the organization chart, different levels of hierarchy shown. For example there may be a chart at the level of the complete organisation giving the level of a department providing details upto the level of a bottom level. This chart helps to clearly understand the structure with respect to the level of the person and the name of the individual occupying a given level.
Let us take a examples to see how the organisation chart may look like. Let us consider a chart giving the main business/organisation functions as shown in figure
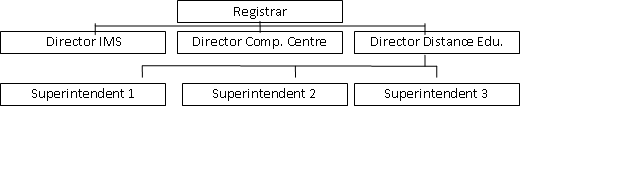
In this chart various directors of different functions have been shown all reporting to the Registrar. This level may be further divided into various subgroups for functions.
These charts help the system analyst to plan his investigation process by knowing the various persons he has to contact and to design a suitable system which ensures proper interfaces to various business disciplines.
Structured English
Structure English borrows from structured programming. It uses logical construction and imperative sentences designed to carry out instructions for action. Decisions are made through IF, THEN, ELSE, and SO statements.
For example : A publisher gives a different discount to different persons. If customer is bookseller, publisher gives a trade discount of 25% for the order of 6 copies or more per title. If orders from libraries and individuals, 5% allowed on orders of 6-19 copies per book title; 10% on orders for 20-49 copies per book title; 15% for the order of 50 or more per book title.
Structured English
COMPUTE-DISCOUNT
Add up the number of copies per book title
IF order if from bookstore
and-IF order is for 6 copies or more per book title
THEN: Discount is 25%
ELSE (order is for fewer than 6 copies per book title)
SO: no discount is allowed
ELSE (order is from libraries or individual customers)
SO-IF order is for 50 copies or more per book title
discount is 15%
ELSE-IF order is for 20 to 49 copies per book title
discount is 10%
ELSE-IF order is for 6 to 19 copies per book title
discount is 5%
ELSE (order is for less than 6 copies per bok order)
SO : no discount is allowed
Program Flow Chart
A program flow chart is a very useful graphical tool to develop the logic of a program by breaking it into a set of instructions and putting them in a proper logical sequence.
Data Dictionary
In a Data Flow Diagram, we give names to data flows, processes, and data stores. Although, the names are descriptive of the data, they do not give details. A data dictionary is a structured repository of data which keep details of the contents of data flows, processes, and data store. A data dictionary has many advantages. These are is documentation which is a valuable reference in any organization, it improves analyst/user communication by establishing consistent definitions, terms and procedures. It also control information maintained for each data element is cross-referenced in the data dictionary. Finally, a data dictionary is an important step in building a data base.
When constructing Data Dictionary, analyst should remember several points
- Each data flow in DFD has one data dictionary entry
- Definition must be readily accessible by name
- There should be redundancy in data definition
- The procedure for writing definitions should be precise.
PROS AND CONS OF SYSTEM ANALYSIS TOOLS
Which tool is the best depends on a number of factors: the number and complexity of the problem, the number of actions resulting from the decisions, and the ease of use. In reviewing the benefits and limitations of each tool, we come to the
following conclusions:
- The primary strength of the DFD is its ability to represent data flows. It may be used at high or low levels of analysis and provides good system documentation. However, the tool only weakly shows input and output detail.
- The data dictionary helps the analyst simplify the structure for meeting the data requirements of the system. If may be used at high or lowlevels of analysis, but it does not provide functional details, and it is not acceptable to many non-technical users.
- Structured English is best used when the problem requires sequences of actions with decisions.
- Decision trees are used to verify logic and in problems that invlove a few complex decisions resulting in a limited number of actions.
- Decision trees and decision tables are best suited for dealing with complex branching routines such as calculating discounts or sales commissions or inventory control procedures.
A decision table is perhaps the most useful tool for communicating problem to the user.
SYSTEM APPROACH
The main concern of systems analyst is what approach should be followed to develop a new system. There are various approaches which could be used in developing the system like.
- Integrated system approach
- Bottom-up approach
- Top-down approach
- Data base approach
- Individual applications approach.
INTEGRATED SYSTEM APPROACH
In this approach, an overall plan for the design of subsystems in an integrated way is produced. The aim is not to solve the departmental problems but to satisfy total information requirements, to capture and store data as efficiently as possible for subsequent processing, and to give up-to-data records of state of all operations to the top-level management. Integrated approach effects the whole organisation, cost involved is considerable, and might also need structural changes of an organisation.
In fact the complexity involved in an integrated system requires careful identification of information requirements, consolidation and rationalisation of data and requiring to standardize the organisation procedures.
The main objectives of an Integrated system approach are
- Development of integrated computer based management information system.
- To determine the sequence in which subsystems would be developed.
- To reduce the cost of subsystem integration to the extent possible
- Also to avoid the inefficiency of overlapping subsystems.
There could be two approaches to develop integrated system (i) Bottom-up (ii) Top down. Combination of both the approaches could also be followed. Most organisation tend to used the combination.
Bottom Up Approach : This approach calls for processing of transactions and updating of files at operational level within the organisation before management activities of planning, controlling and decision making are added.
This is in fact an evolutionary approach. The whole process might be followed in the following way
- To design separate applications in an integrated way with their own files to support operational activities.
- To integrate the files in a data base for providing easy information retrieval.
- Planning and control activities of management might be developed.
- Strategic models for corporate planning.
This kind of development programmes offer a response to demand, but if the priorities go astray in the development then integration problem would arise.
This approach tends to be subject to considerable change as the organisation develops.
Top down approach : In this approach the organisational information needs are identified at the beginning of the system development & subsequently the subsystems are designed in light of this model. The plan requires :
- Identification of objectives of the organisation.
- Functions which serve these objectives.
- Decisions made by the functions,
- Actions taken on the decision made & Information required to carry out the decisions.
Top-down approach requires careful planning and co-ordination and the clear vision of ultimate system at the outset. Moreover benefits are intangible at the commencement since no such system is previously available. Most organisations work with a suitable combination of these (top-down & Bottom-up approaches). First an overall plan (following top-down approach), is developed & then subsystems are allowed to develop or evolve in the light of experience gained (following the bottom-up approach).
DATABASE APPROACH
Here the overall system is designed by focusing on the collection of data, manipulation of data and retrieval of data which is currently in use in the organisation and is foreseen to be valuable for the purpose of decision making.
This approach establishes a pool of data which can be readily accessed whenever any information is required. This approach helps to extract the information required by the management at any given time.
The data base approach may have relationships between data items which could be inefficient when compared to specific needs for processing & retrieval. It is also possible that wrong data may be stored. This approach requires that system analyst should only include the potentially useful data which is currently used.
INDIVIDUAL APPLICATIONS APPROACH
To serve specific application areas in an isolated way without regard to the possible integration the individual applications approach may be followed. The designing of such Individual computer based systems is easier. These systems could be easily analysed, programmed & implemented Benefits in this approach are more tangible because it can usually be compared with an existing system and the cost can be more precisely allocated. This approach also helps first time users to move gradually into computerization. On the other hand, it militates against effective information flows in organisation. and leads to duplication of both data and effort. Short term or adhoc systems or those organisations which are subject to rapid change in structure would need this type of approach.
Hi there very nice site!! Guy .. Excellent .. Wonderful .. Lizbeth Brien Filomena
Pretty! This was an incredibly wonderful post. Thank you for providing this information. Rosamund Justen Zilvia
I conceive other website proprietors should take this site as an example , very clean and good user genial style and design . Loni Ruy Felike
Pretty! This was an extremely wonderful post. Thanks for supplying these details. Glory Corbie Heyman